Bagaimana itu bekerja
Masukkan Data
Sesuaikan Bagan
Simpan dan Bagikan
fitur
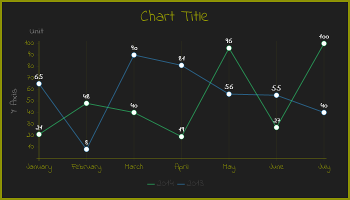
Pratinjau Langsung
Lihat dulu bagaimana grafik terlihat secara real time
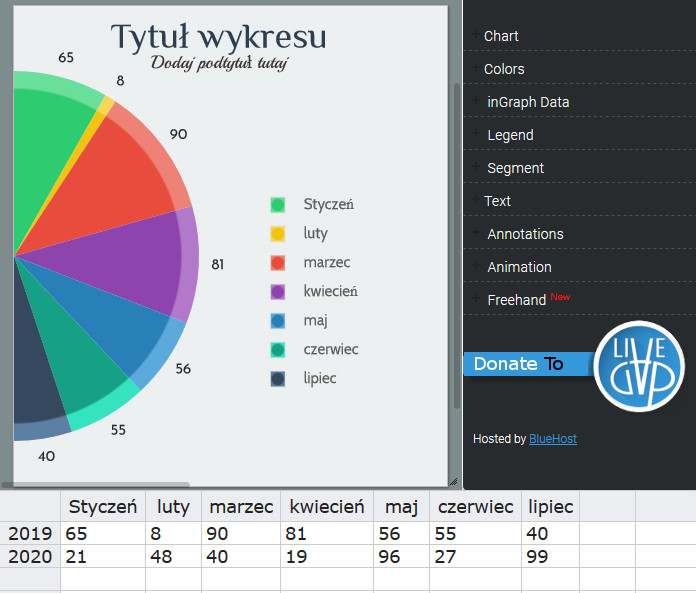
Opsi penyesuaian
Banyak opsi penyesuaian (Warna, Margin, Teks, Legenda, Font, Gradien ....)
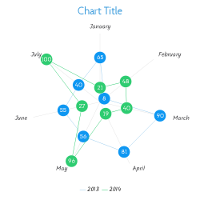
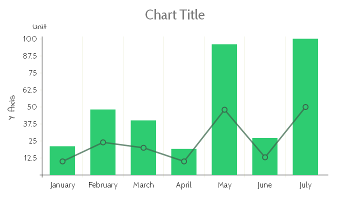
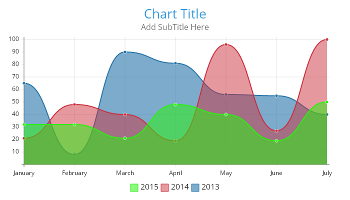
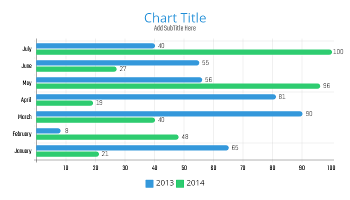
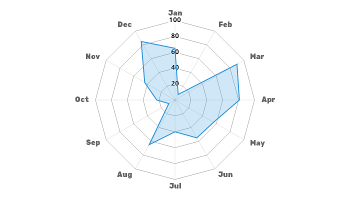
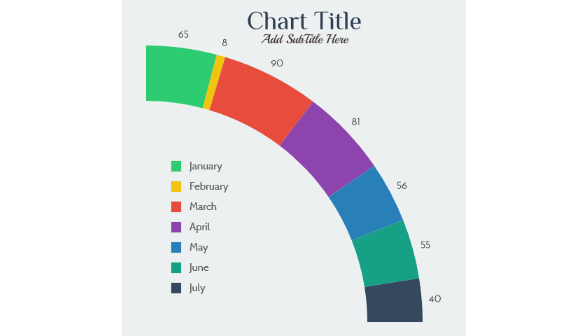
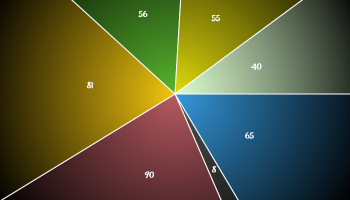
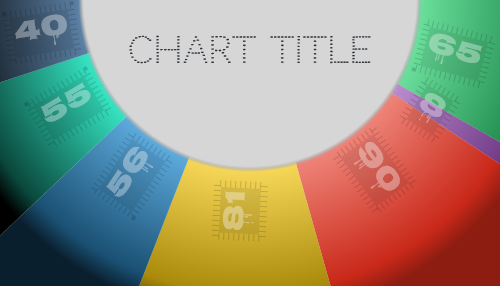
Templat bagan
Buat visualisasi data yang indah dengan lebih dari 50 templat grafik
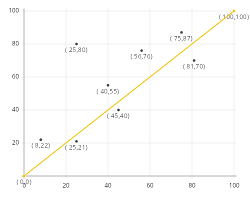
Galeri

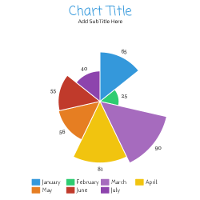
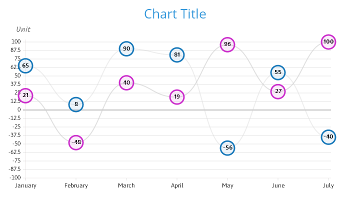
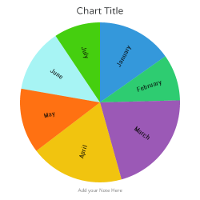
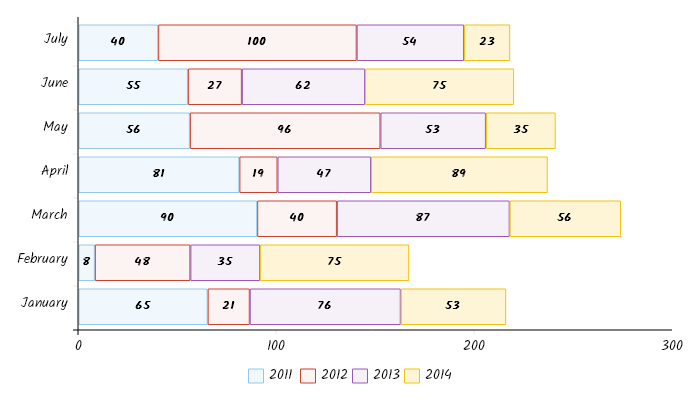
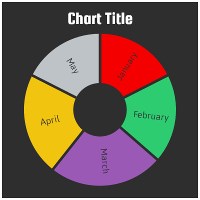
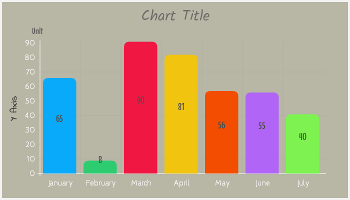
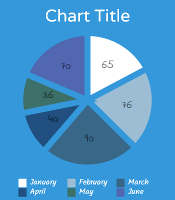
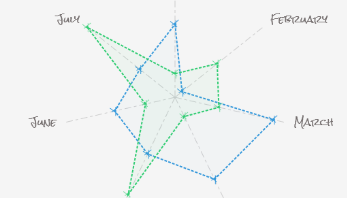
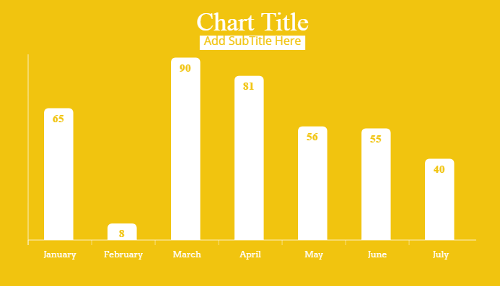
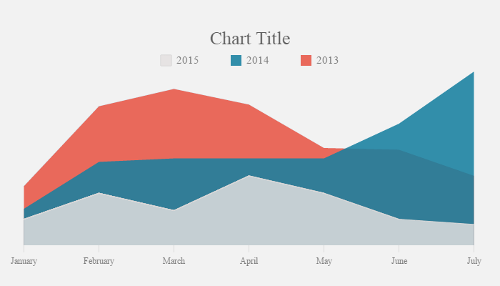
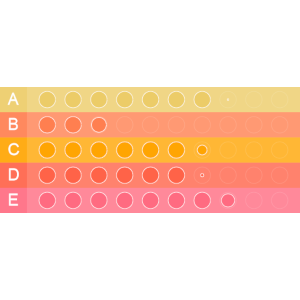
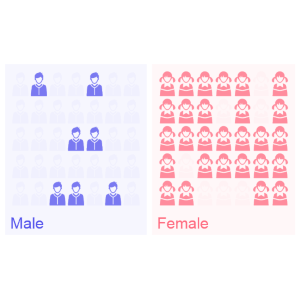
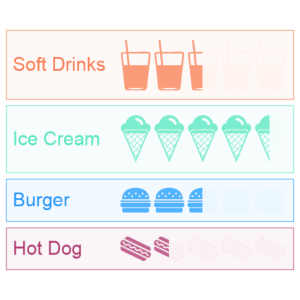
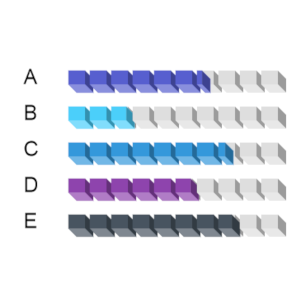
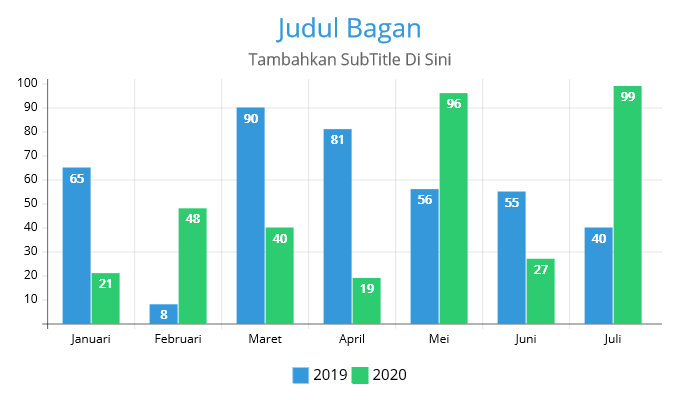
LiveGap Charts is a free website where teachers can create and share all kinds of charts: line, bar, area, pie, radar, icon matrix, and more. Start with a template and then edit the data in the spreadsheet (or copy it from your own spreadsheet). From there, there are tons of customization options. When finished, save the chart as an image or HTML, or create an account to save and share it online.

Thank you to Omar Sedki, for the nudge towards https://livegap.com/charts/ to make simple, but superb, online graphs, with a live preview as you change data. Create a line chart, bar chart, or radar chart, and then edit it in real time.

When you or your students just need to quickly generate a chart to use in a slide or share in a blog post. LiveGap Charts Builder will let you and your students quickly generate charts from simple data sets.