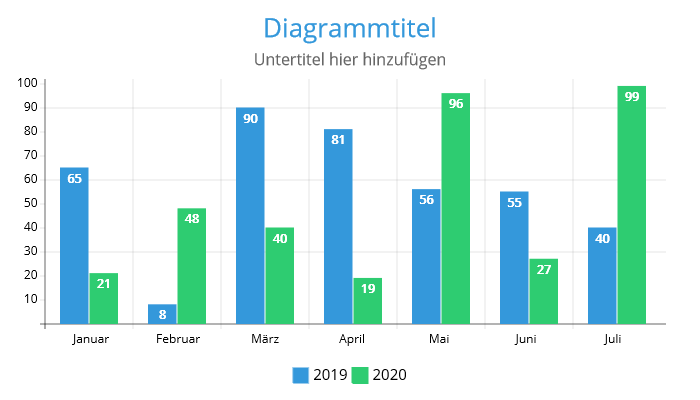
Wie es funktioniert
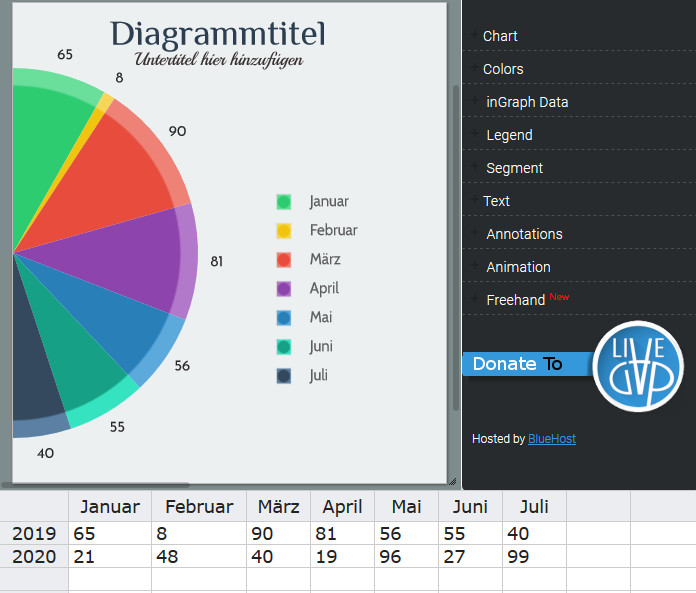
Geben Sie die Daten ein
Fügen Sie Ihre Daten in das Tabellenkalkulationsfenster ein.Sie können es auch aus Excel oder einer beliebigen Tabelle kopieren.
Passen Sie das Diagramm an
Ändern Sie Diagrammtyp, Farben, Texte, Schriftarten, Rahmen, Hintergrund, Linienstil, Achsen, Legende ...
Speichern und teilen
Speichern Sie Ihr Diagramm als Bild oder als Webseite (animiert) oder speichern Sie es online, um von überall darauf zuzugreifen, oder teilen Sie es mit Freunden.
Eigenschaften
Live Vorschau
Vorschau, wie das Diagramm in Echtzeit aussieht
Anpassungsoptionen
Tonnenweise Anpassungsoptionen (Farben, Ränder, Texte, Legenden, Schriftarten, Verläufe ...)
Diagrammvorlagen
Erstellen Sie wunderschöne Datenvisualisierungen mit mehr als 50 Diagrammvorlagen
Galerie
Bearbeiten Sie diese Vorlage
Bearbeiten Sie diese Vorlage
Bearbeiten Sie diese Vorlage
Bearbeiten Sie diese Vorlage
Bearbeiten Sie diese Vorlage
Bearbeiten Sie diese Vorlage
Bearbeiten Sie diese Vorlage
Bearbeiten Sie diese Vorlage
Bearbeiten Sie diese Vorlage
Bearbeiten Sie diese Vorlage
Bearbeiten Sie diese Vorlage
Bearbeiten Sie diese Vorlage
Bearbeiten Sie diese Vorlage
Bearbeiten Sie diese Vorlage
Bearbeiten Sie diese Vorlage
Bearbeiten Sie diese Vorlage
Bearbeiten Sie diese Vorlage
Bearbeiten Sie diese Vorlage
Bearbeiten Sie diese Vorlage
Bearbeiten Sie diese Vorlage
Bearbeiten Sie diese Vorlage
Bearbeiten Sie diese Vorlage
Bearbeiten Sie diese Vorlage
Bearbeiten Sie diese Vorlage
Bearbeiten Sie diese Vorlage
Bearbeiten Sie diese Vorlage
Bearbeiten Sie diese Vorlage
Bearbeiten Sie diese Vorlage
Bearbeiten Sie diese Vorlage
Bearbeiten Sie diese Vorlage
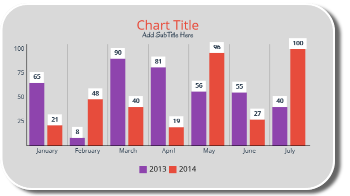
Bearbeiten Sie diese Vorlage
Bearbeiten Sie diese Vorlage
Bearbeiten Sie diese Vorlage
Bearbeiten Sie diese Vorlage
Bearbeiten Sie diese Vorlage
Bearbeiten Sie diese Vorlage
Bearbeiten Sie diese Vorlage
Bearbeiten Sie diese Vorlage
Bearbeiten Sie diese Vorlage
Bearbeiten Sie diese Vorlage
Bearbeiten Sie diese Vorlage
Bearbeiten Sie diese Vorlage
Bearbeiten Sie diese Vorlage
