

这个怎么运作
输入数据
自定义图表
保存并分享
为什么选择 Livegap Charts?
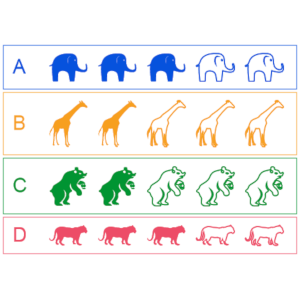
Livegap Charts 是一款免费的图表制作工具,可让您在几分钟内在线创建专业图表。 提供50多种模板,包括折线图、柱状图、饼图、雷达图、图标矩阵和多图布局。 支持从CSV或XLSX文件导入数据,包括多工作表。 可根据需要隐藏或显示行和列,实现完全控制。 使用预设颜色、标签和图标自定义图表。 通过实时预览即时查看更改。 将图表导出为图片、动画或SVG,用于演示、网站或报告。 非常适合学生、教师和专业人士。 在一个项目中创建多个图表并组合使用。
特征
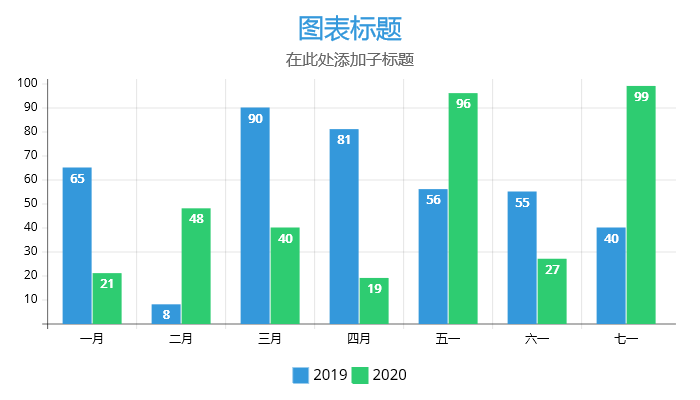
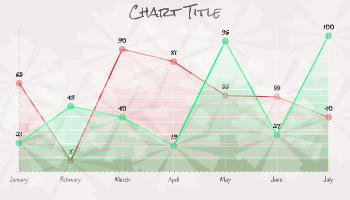
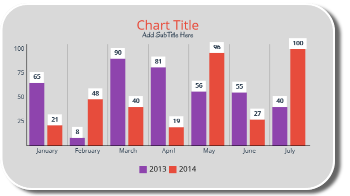
实时预览
实时预览图表的外观
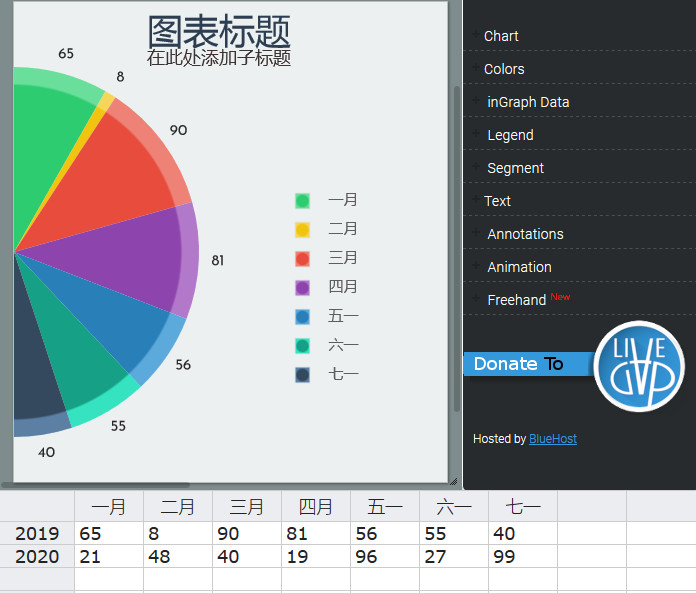
定制选项
大量的自定义选项(颜色,边距,文本,图例,字体,渐变....)
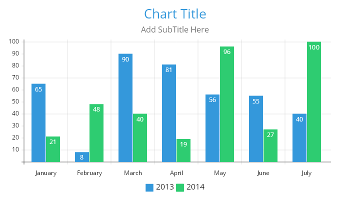
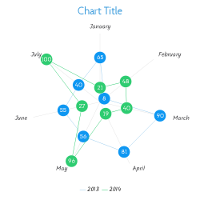
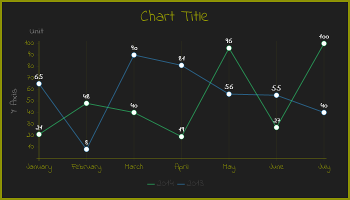
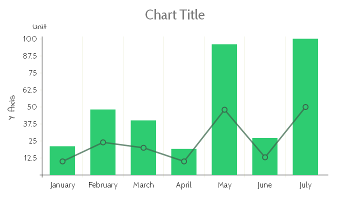
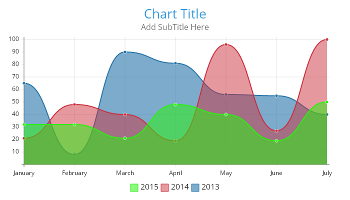
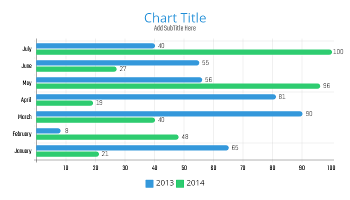
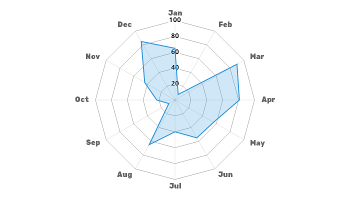
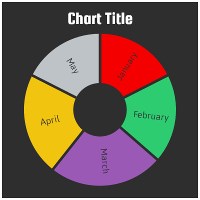
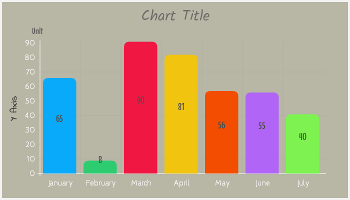
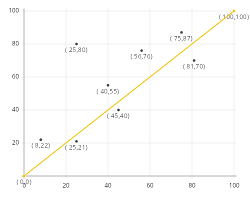
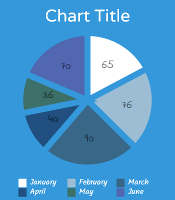
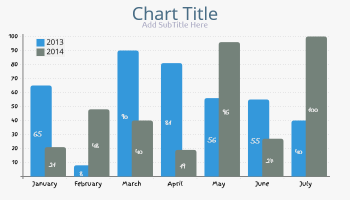
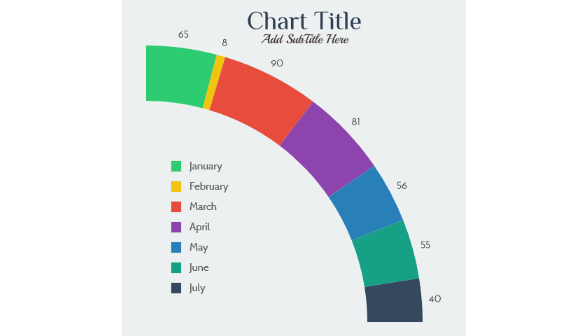
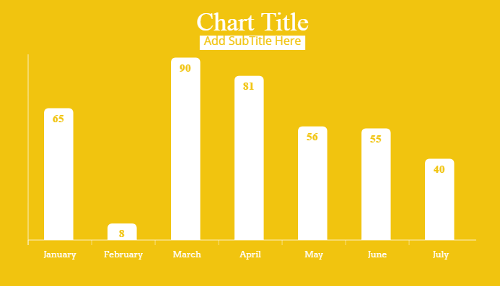
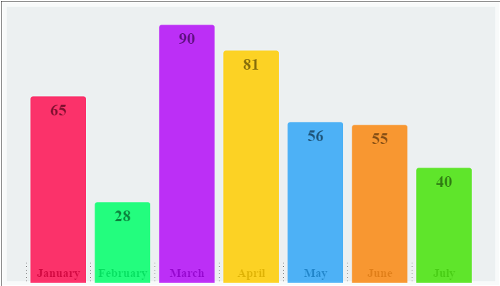
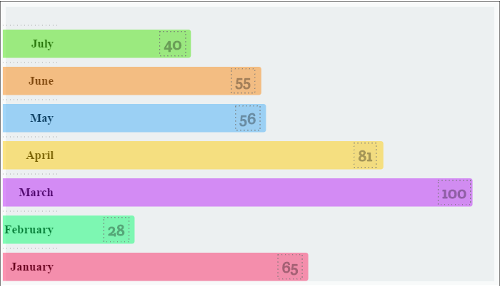
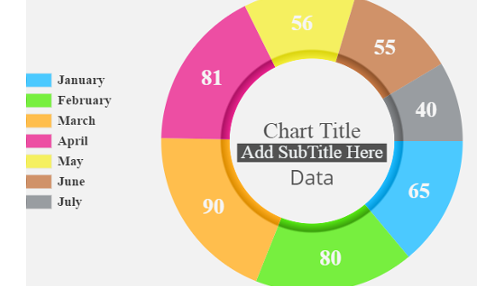
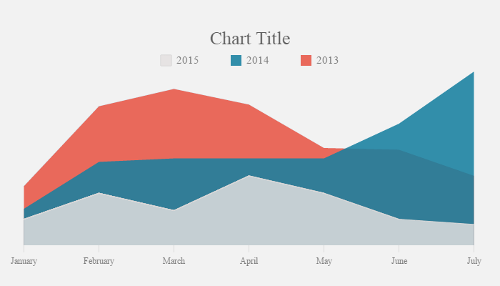
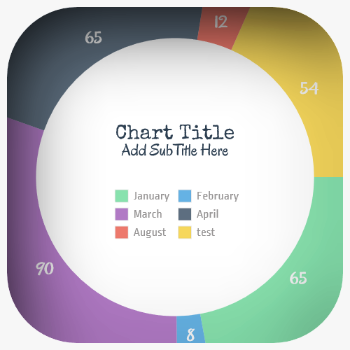
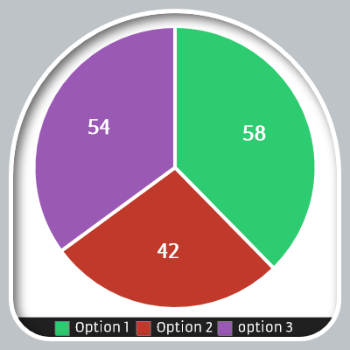
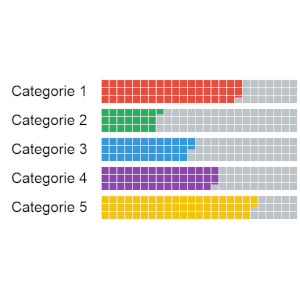
图表模板
使用50多种图表模板进行漂亮的数据可视化
更喜欢桌面应用体验吗?
您也可以从微软商店下载适用于 Windows 的 Livegap Charts:

或者直接在您的浏览器中继续使用 Livegap Charts,无需安装。
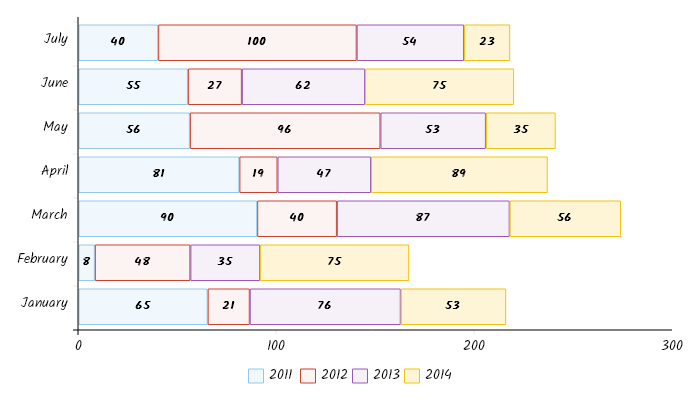


LiveGap Charts is a free website where teachers can create and share all kinds of charts: line, bar, area, pie, radar, icon matrix, and more. Start with a template and then edit the data in the spreadsheet (or copy it from your own spreadsheet). From there, there are tons of customization options. When finished, save the chart as an image or HTML, or create an account to save and share it online.

Thank you to Omar Sedki, for the nudge towards https://livegap.com/charts/ to make simple, but superb, online graphs, with a live preview as you change data. Create a line chart, bar chart, or radar chart, and then edit it in real time.

When you or your students just need to quickly generate a chart to use in a slide or share in a blog post. LiveGap Charts Builder will let you and your students quickly generate charts from simple data sets.