
Jak to działa
Wprowadź dane
Dostosuj wykres
Zapisz i udostępnij
cechy
Podgląd na żywo
Zobacz, jak wygląda wykres w czasie rzeczywistym
Opcje dostosowywania
Mnóstwo opcji dostosowywania (kolory, marginesy, teksty, legenda, czcionki, gradienty ...)
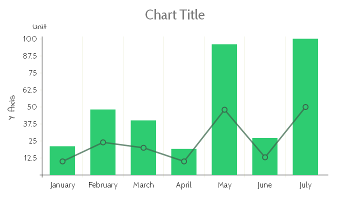
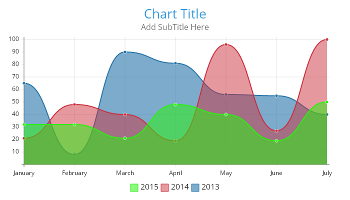
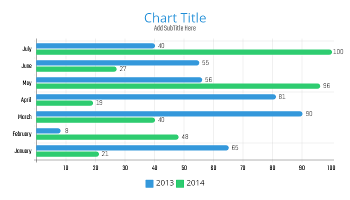
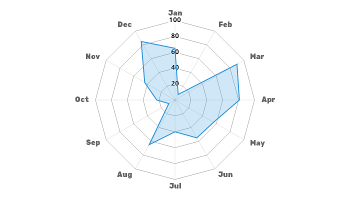
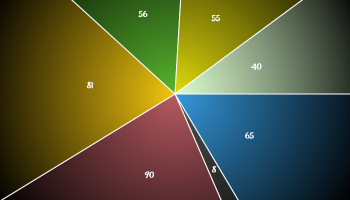
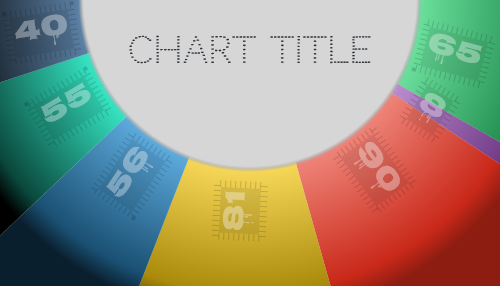
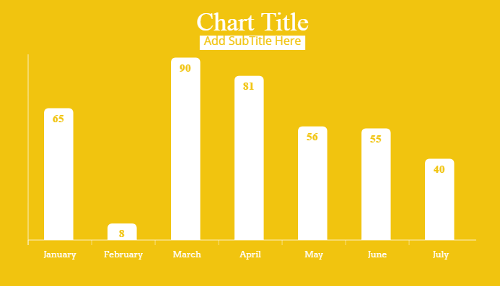
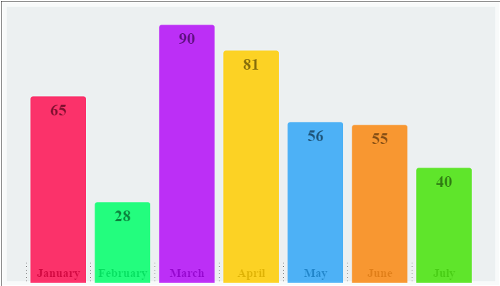
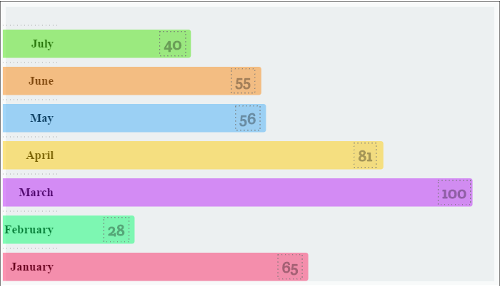
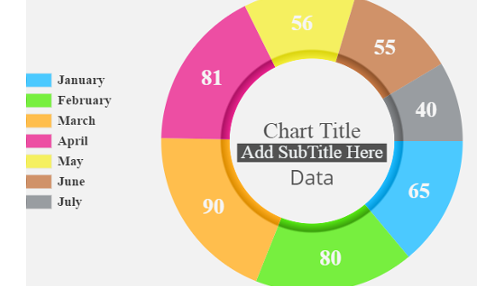
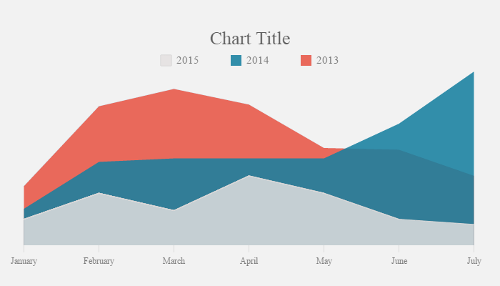
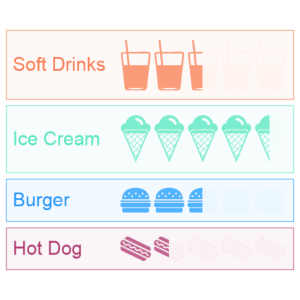
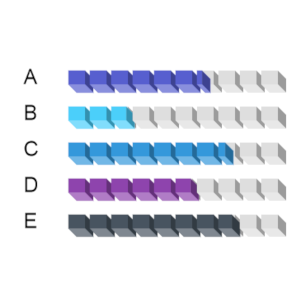
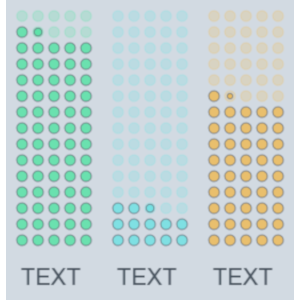
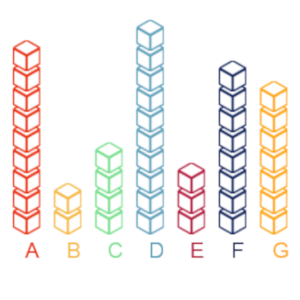
Szablony wykresów
Twórz piękne wizualizacje danych za pomocą ponad 50 szablonów wykresów
Platinum Sponsor Membership
$50 /month
Join us as a sponsor and get Livegap Charts Pro without ads for all your employees,students ....*** you can try it for free for 7 days.


Pro Version
Get Charts Pro accounts without ads for all your employees,students
More Templates & Fonts Soon
Unlock more than 25 Templates and 200 Fonts
Save
Save Charts as animated HTML , Save to your PC
Galeria
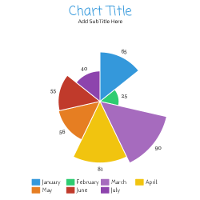
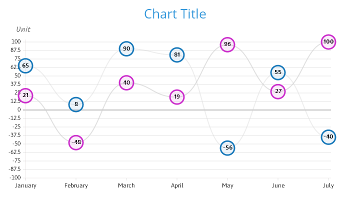
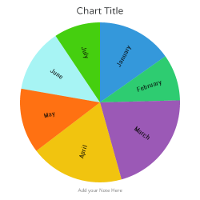
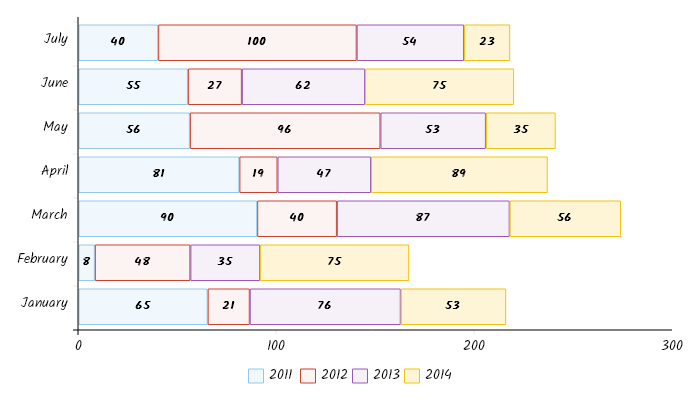
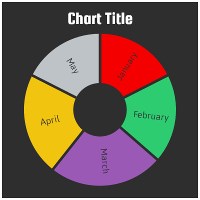
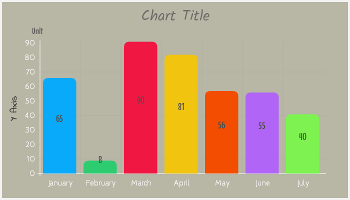
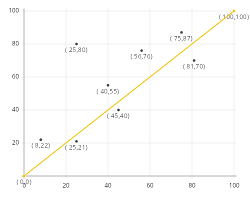
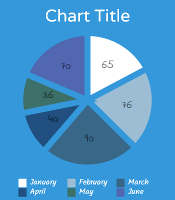

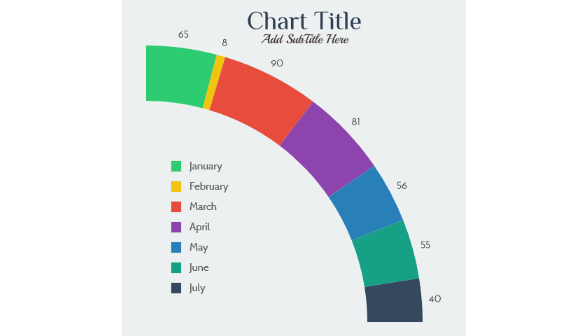
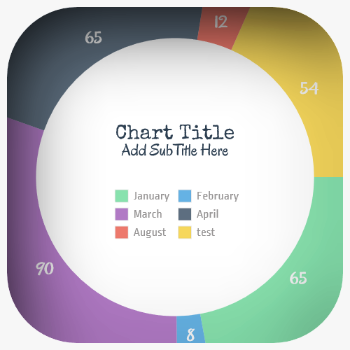
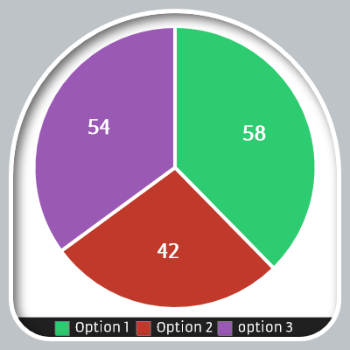
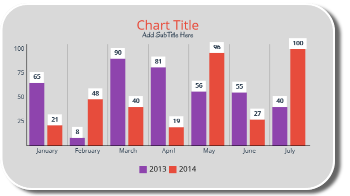
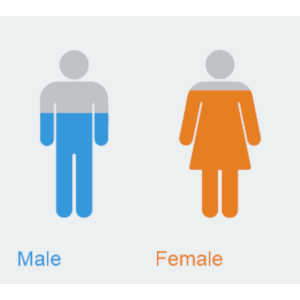
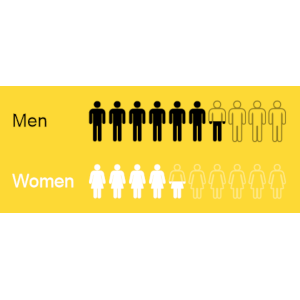
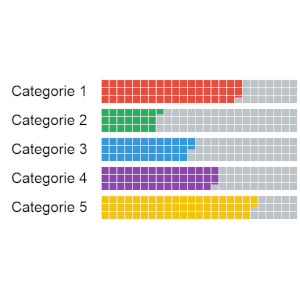

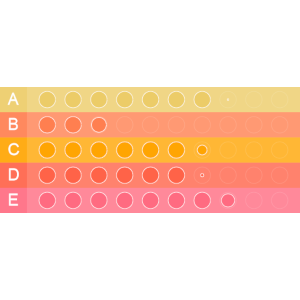
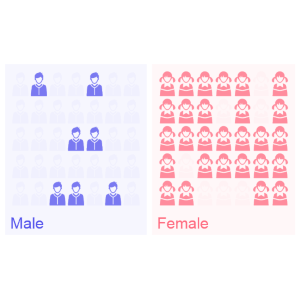

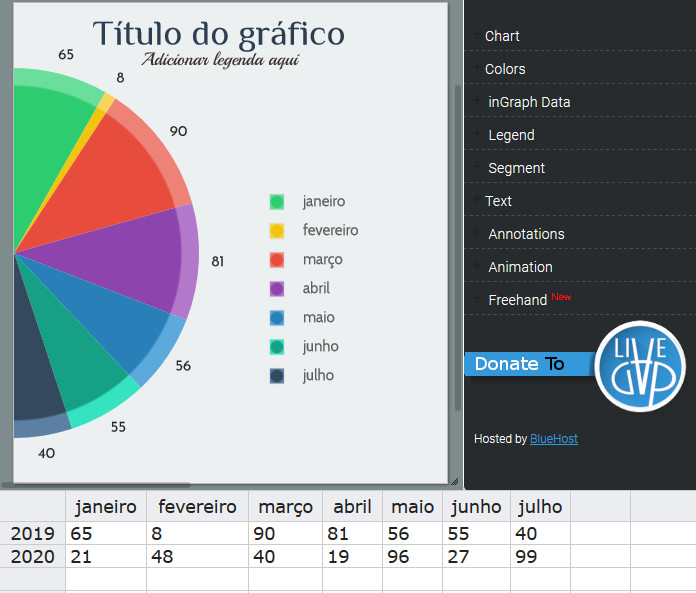
LiveGap Charts is a free website where teachers can create and share all kinds of charts: line, bar, area, pie, radar, icon matrix, and more. Start with a template and then edit the data in the spreadsheet (or copy it from your own spreadsheet). From there, there are tons of customization options. When finished, save the chart as an image or HTML, or create an account to save and share it online.

Thank you to Omar Sedki, for the nudge towards https://livegap.com/charts/ to make simple, but superb, online graphs, with a live preview as you change data. Create a line chart, bar chart, or radar chart, and then edit it in real time.

When you or your students just need to quickly generate a chart to use in a slide or share in a blog post. LiveGap Charts Builder will let you and your students quickly generate charts from simple data sets.