


How it Works
Enter The Data
Customize The Chart
Save & Share
ทำไมต้องเลือก Livegap Charts?
Livegap Charts เป็นเครื่องมือสร้างแผนภูมิและกราฟฟรี ที่ช่วยให้คุณสร้างแผนภูมิระดับมืออาชีพออนไลน์ได้ภายในไม่กี่นาที เลือกจากเทมเพลตกว่า 50 แบบ เช่น แผนภูมิเส้น แผนภูมิแท่ง แผนภูมิวงกลม เรดาร์ เมทริกซ์ไอคอน และเลย์เอาต์หลายกราฟ นำเข้าข้อมูลจากไฟล์ CSV หรือ XLSX ได้อย่างง่ายดาย รวมถึงหลายชีต ซ่อนหรือแสดงคอลัมน์และแถวตามต้องการเพื่อการควบคุมเต็มรูปแบบ ปรับแต่งแผนภูมิด้วยสี ป้ายกำกับ และไอคอนแบบไดนามิก ดูการเปลี่ยนแปลงทันทีด้วยการแสดงตัวอย่างแบบเรียลไทม์ ส่งออกแผนภูมิเป็นภาพ ไฟล์แอนิเมชัน หรือ SVG สำหรับงานนำเสนอ เว็บไซต์ หรือรายงาน เหมาะสำหรับนักเรียน ครู และมืออาชีพ สร้างหลายแผนภูมิในโปรเจกต์เดียวและรวมเข้าด้วยกัน
Features
Live Preview
Preview how the chart look like in real time
Customization options
Tons of customization options ( Colors, Margins, Texts, Legend, Fonts, Gradients .... )
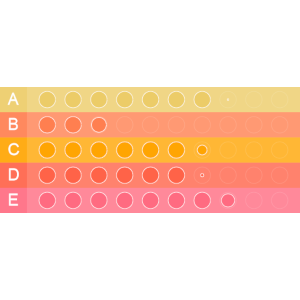
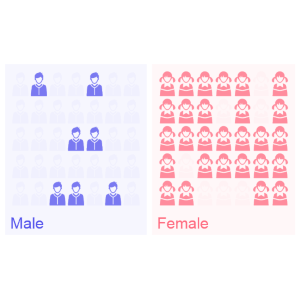
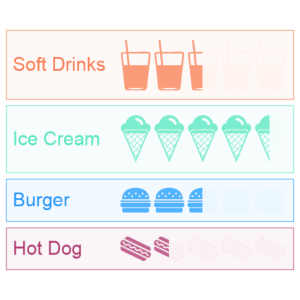
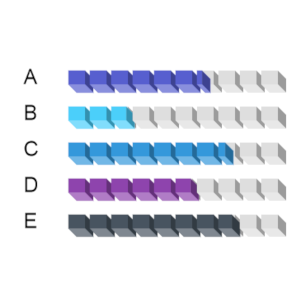
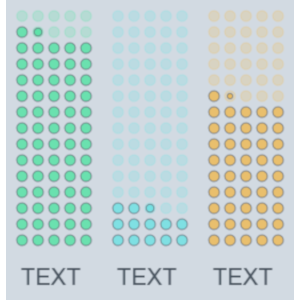
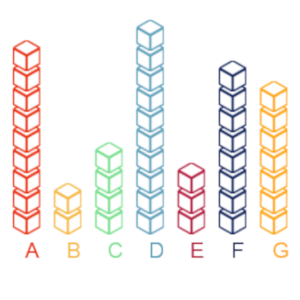
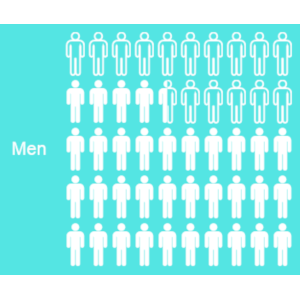
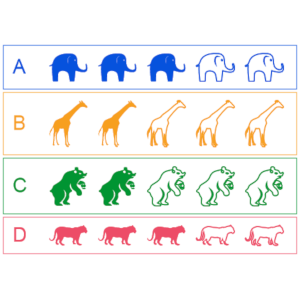
Chart templates
Make beautiful data visualizations with more than 50 chart Templates

ต้องการประสบการณ์แอปเดสก์ท็อปหรือไม่?
คุณสามารถดาวน์โหลด Livegap Charts สำหรับ Windows จาก Microsoft Store ได้เช่นกัน:

หรือใช้งาน Livegap Charts ต่อในเบราว์เซอร์ของคุณได้เลย ไม่ต้องติดตั้ง
แกลเลอรี


LiveGap Charts is a free website where teachers can create and share all kinds of charts: line, bar, area, pie, radar, icon matrix, and more. Start with a template and then edit the data in the spreadsheet (or copy it from your own spreadsheet). From there, there are tons of customization options. When finished, save the chart as an image or HTML, or create an account to save and share it online.

Thank you to Omar Sedki, for the nudge towards https://livegap.com/charts/ to make simple, but superb, online graphs, with a live preview as you change data. Create a line chart, bar chart, or radar chart, and then edit it in real time.

When you or your students just need to quickly generate a chart to use in a slide or share in a blog post. LiveGap Charts Builder will let you and your students quickly generate charts from simple data sets.