


How it Works
Enter The Data
Customize The Chart
Save & Share
Varför välja Livegap Charts?
Livegap Charts är ett gratis verktyg för att skapa diagram och grafer online på bara några minuter. Välj bland över 50 mallar, inklusive linjediagram, stapeldiagram, cirkeldiagram, radardiagram, ikonmatriser och layouter med flera diagram. Importera enkelt data från CSV- eller XLSX-filer, inklusive flera ark. Dölj eller visa kolumner och rader efter behov för full kontroll. Anpassa dina diagram med dynamiska färger, etiketter och ikoner. Se ändringar direkt med realtidsförhandsvisning. Exportera diagram som bilder, animerade filer eller SVG för presentationer, webbplatser eller rapporter. Perfekt för studenter, lärare och yrkesverksamma. Skapa flera diagram i ett projekt och kombinera dem.
Features
Live Preview
Preview how the chart look like in real time
Customization options
Tons of customization options ( Colors, Margins, Texts, Legend, Fonts, Gradients .... )
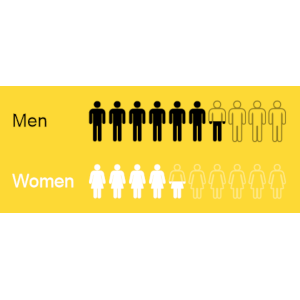
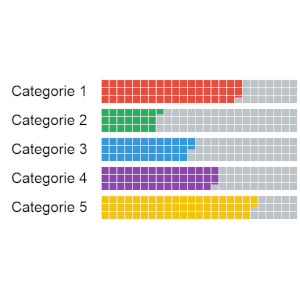
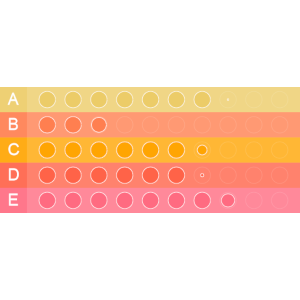
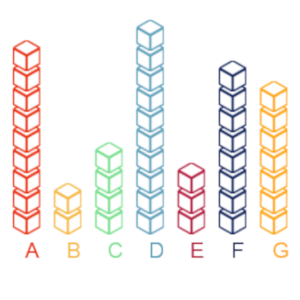
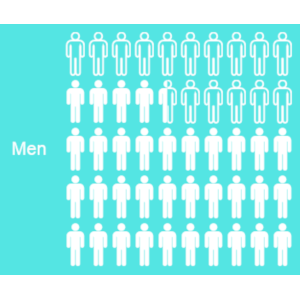
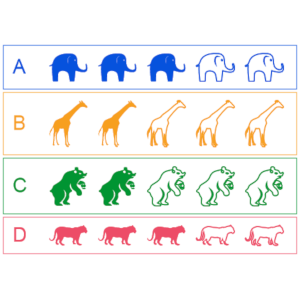
Chart templates
Make beautiful data visualizations with more than 50 chart Templates

Föredrar du en desktop-app-upplevelse?
Du kan också ladda ner Livegap Charts för Windows från Microsoft Store:

Eller fortsätt använda Livegap Charts direkt i din webbläsare – ingen installation krävs.
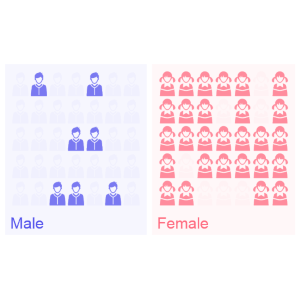
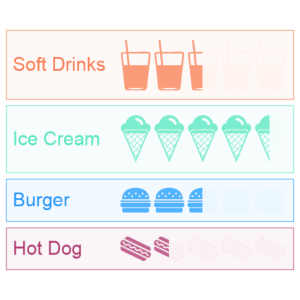
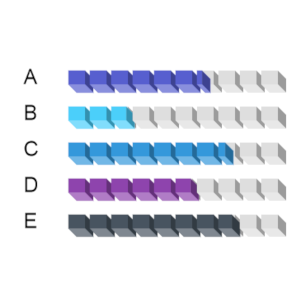
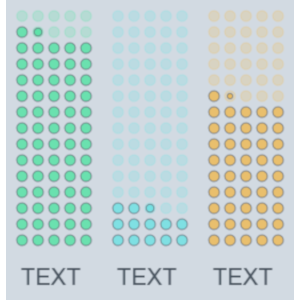
Galleri


LiveGap Charts is a free website where teachers can create and share all kinds of charts: line, bar, area, pie, radar, icon matrix, and more. Start with a template and then edit the data in the spreadsheet (or copy it from your own spreadsheet). From there, there are tons of customization options. When finished, save the chart as an image or HTML, or create an account to save and share it online.

Thank you to Omar Sedki, for the nudge towards https://livegap.com/charts/ to make simple, but superb, online graphs, with a live preview as you change data. Create a line chart, bar chart, or radar chart, and then edit it in real time.

When you or your students just need to quickly generate a chart to use in a slide or share in a blog post. LiveGap Charts Builder will let you and your students quickly generate charts from simple data sets.