


How it Works
Enter The Data
Customize The Chart
Save & Share
Why Choose Livegap Charts?
Livegap Charts is a free Chart Maker & Graph Maker that lets you create professional charts online in minutes. Choose from over 50 templates, including line charts, bar charts, pie charts, radar charts, icon matrices, and multi-chart layouts. Import your data easily from CSV or XLSX files, including multi-sheet spreadsheets. Hide or show columns and rows as needed for full control of your charts. Customize your charts with dynamic preset colors, labels, and icons for a stunning visual appearance. See your changes instantly with our real-time live preview feature. Export your charts as images, animated files, or SVG for use in presentations, websites, or reports. Perfect for students, teachers, and professionals who need charts quickly and effortlessly. Create multiple charts in one project and combine them for dashboards or reports.
Features
Live Preview
Preview how the chart look like in real time
Customization options
Tons of customization options ( Colors, Margins, Texts, Legend, Fonts, Gradients .... )
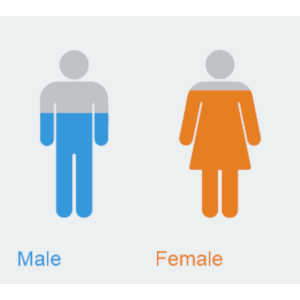
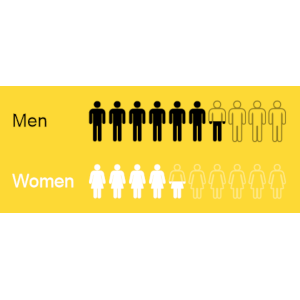
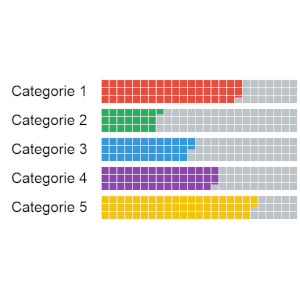
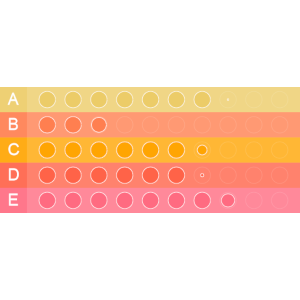
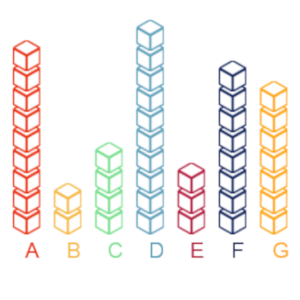
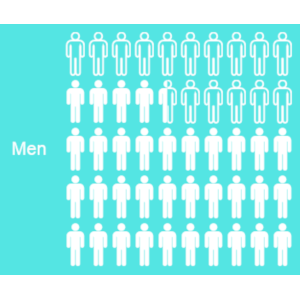
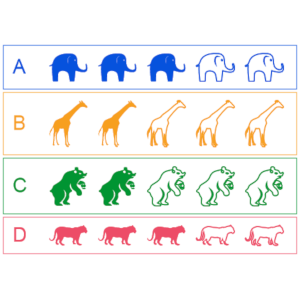
Chart templates
Make beautiful data visualizations with more than 50 chart Templates

Prefer a desktop app experience?
You can also download Livegap Charts for Windows from the Microsoft Store:

Or continue using Livegap Charts right here in your browser — no installation required.
Gallery


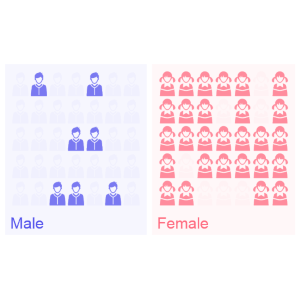
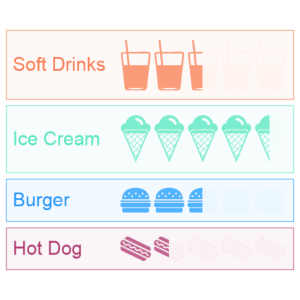
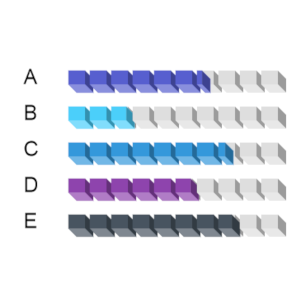
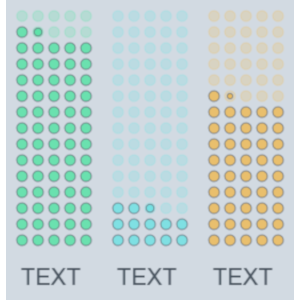

LiveGap Charts is a free website where teachers can create and share all kinds of charts: line, bar, area, pie, radar, icon matrix, and more. Start with a template and then edit the data in the spreadsheet (or copy it from your own spreadsheet). From there, there are tons of customization options. When finished, save the chart as an image or HTML, or create an account to save and share it online.

Thank you to Omar Sedki, for the nudge towards https://livegap.com/charts/ to make simple, but superb, online graphs, with a live preview as you change data. Create a line chart, bar chart, or radar chart, and then edit it in real time.

When you or your students just need to quickly generate a chart to use in a slide or share in a blog post. LiveGap Charts Builder will let you and your students quickly generate charts from simple data sets.