


How it Works
Enter The Data
Customize The Chart
Save & Share
Tại sao chọn Livegap Charts?
Livegap Charts là công cụ tạo biểu đồ và đồ thị miễn phí, cho phép bạn tạo biểu đồ chuyên nghiệp trực tuyến chỉ trong vài phút. Chọn từ hơn 50 mẫu, bao gồm biểu đồ đường, cột, tròn, radar, ma trận biểu tượng và bố cục nhiều biểu đồ. Dễ dàng nhập dữ liệu từ tệp CSV hoặc XLSX, bao gồm nhiều trang tính. Ẩn hoặc hiển thị hàng và cột theo nhu cầu để kiểm soát hoàn toàn. Tùy chỉnh biểu đồ với màu sắc, nhãn và biểu tượng động. Xem thay đổi ngay lập tức với tính năng xem trước theo thời gian thực. Xuất biểu đồ dưới dạng hình ảnh, tệp động hoặc SVG cho thuyết trình, trang web hoặc báo cáo. Phù hợp cho học sinh, giáo viên và chuyên gia. Tạo nhiều biểu đồ trong một dự án và kết hợp chúng.
Features
Live Preview
Preview how the chart look like in real time
Customization options
Tons of customization options ( Colors, Margins, Texts, Legend, Fonts, Gradients .... )
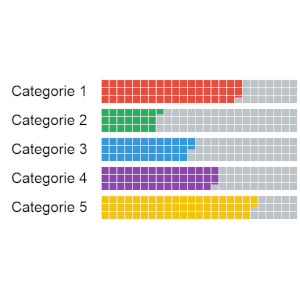
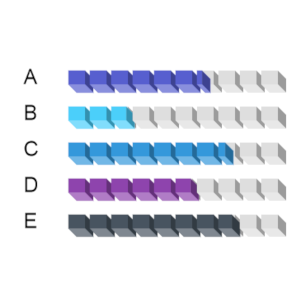
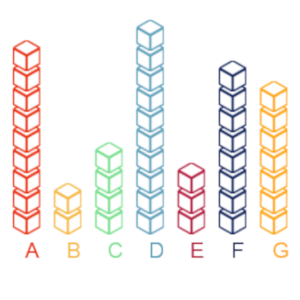
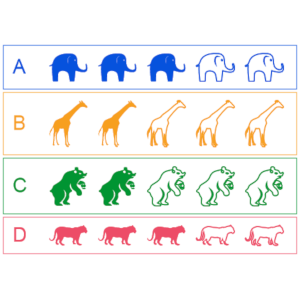
Chart templates
Make beautiful data visualizations with more than 50 chart Templates

Bạn thích trải nghiệm ứng dụng trên máy tính để bàn?
Bạn cũng có thể tải Livegap Charts cho Windows từ Microsoft Store:

Hoặc tiếp tục sử dụng Livegap Charts ngay trên trình duyệt — không cần cài đặt.
Thư viện


LiveGap Charts is a free website where teachers can create and share all kinds of charts: line, bar, area, pie, radar, icon matrix, and more. Start with a template and then edit the data in the spreadsheet (or copy it from your own spreadsheet). From there, there are tons of customization options. When finished, save the chart as an image or HTML, or create an account to save and share it online.

Thank you to Omar Sedki, for the nudge towards https://livegap.com/charts/ to make simple, but superb, online graphs, with a live preview as you change data. Create a line chart, bar chart, or radar chart, and then edit it in real time.

When you or your students just need to quickly generate a chart to use in a slide or share in a blog post. LiveGap Charts Builder will let you and your students quickly generate charts from simple data sets.