


How it Works
Enter The Data
Customize The Chart
Save & Share
Neden Livegap Charts'i seçmelisiniz?
Livegap Charts, dakikalar içinde profesyonel grafikler oluşturmanıza olanak tanıyan ücretsiz bir grafik oluşturucudur. Çizgi grafikler, sütun grafikler, pasta grafikler, radar grafikler, ikon matrisleri ve çoklu grafik düzenleri dahil 50'den fazla şablon arasından seçim yapın. Verilerinizi CSV veya XLSX dosyalarından (çoklu sayfalar dahil) kolayca içe aktarın. Tam kontrol için sütunları ve satırları gerektiği gibi gizleyin veya gösterin. Grafiklerinizi dinamik renkler, etiketler ve ikonlarla özelleştirin. Gerçek zamanlı canlı önizleme ile değişiklikleri anında görün. Grafiklerinizi sunumlar, web siteleri veya raporlar için görüntü, animasyonlu dosya veya SVG olarak dışa aktarın. Öğrenciler, öğretmenler ve profesyoneller için idealdir. Tek bir projede birden fazla grafik oluşturun ve birleştirin.
Features
Live Preview
Preview how the chart look like in real time
Customization options
Tons of customization options ( Colors, Margins, Texts, Legend, Fonts, Gradients .... )
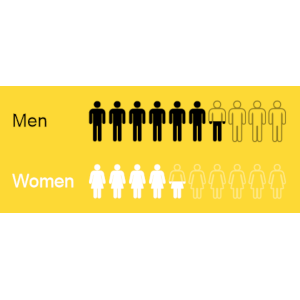
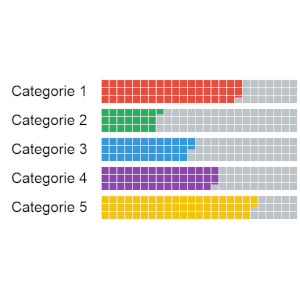
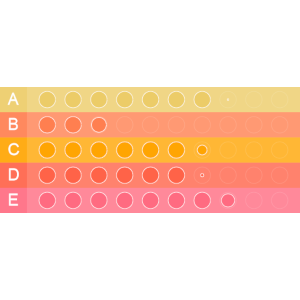
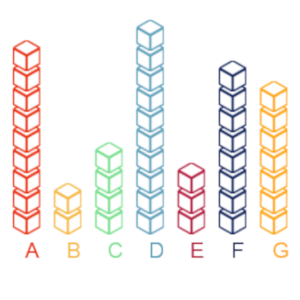
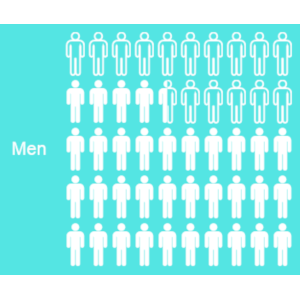
Chart templates
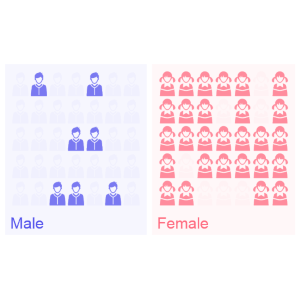
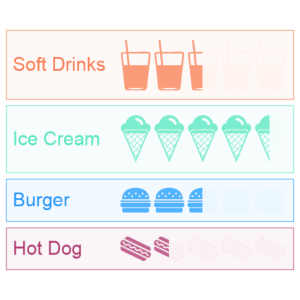
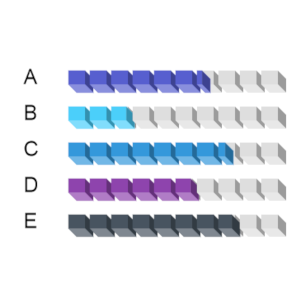
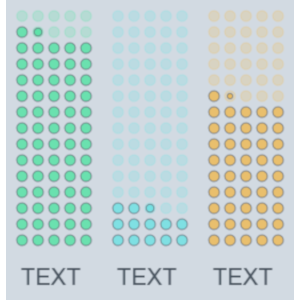
Make beautiful data visualizations with more than 50 chart Templates

Masaüstü uygulama deneyimini mi tercih ediyorsunuz?
Livegap Charts’ı Windows için Microsoft Store’dan da indirebilirsiniz:

Veya hiçbir kurulum gerektirmeden tarayıcınızda Livegap Charts’ı kullanmaya devam edin.
Galeri


LiveGap Charts is a free website where teachers can create and share all kinds of charts: line, bar, area, pie, radar, icon matrix, and more. Start with a template and then edit the data in the spreadsheet (or copy it from your own spreadsheet). From there, there are tons of customization options. When finished, save the chart as an image or HTML, or create an account to save and share it online.

Thank you to Omar Sedki, for the nudge towards https://livegap.com/charts/ to make simple, but superb, online graphs, with a live preview as you change data. Create a line chart, bar chart, or radar chart, and then edit it in real time.

When you or your students just need to quickly generate a chart to use in a slide or share in a blog post. LiveGap Charts Builder will let you and your students quickly generate charts from simple data sets.